Category:Language-neutral pie charts
Jump to navigation
Jump to search
Subcategories
This category has only the following subcategory.
*
Media in category "Language-neutral pie charts"
The following 135 files are in this category, out of 135 total.
-
 2007 results.png 483 × 291; 6 KB
-
 2008 Democratic Primaries, Exit Polls by Age.png 653 × 661; 11 KB
-
 2377657ytghj.png 613 × 331; 49 KB
-
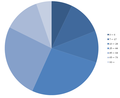
 60% Chart.png 507 × 544; 10 KB
-
 Age groups Karlstad.png 635 × 517; 21 KB
-
 Alliance pour la Suède rapports de force.png 609 × 607; 14 KB
-
 Allianz AG.png 1,024 × 1,024; 53 KB
-
 Amel - Terreny.png 1,116 × 1,021; 1.44 MB
-
 Animated colorful pie chart small slice.gif 253 × 256; 39 KB
-
 Animated pie chart backwards green pink 360 to 0.gif 315 × 315; 149 KB
-
 Animated pie chart green pink 0 to 360.gif 525 × 525; 114 KB
-
 Animated pie chart green pink with legend.gif 800 × 600; 256 KB
-
 Animated pie chart pink green 0 to 360.gif 315 × 315; 90 KB
-
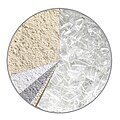 Anteile Rohstoffe in Behaelterglas.jpg 850 × 850; 479 KB
-
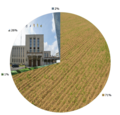
 Anthisnes - terrain.jpg 1,067 × 934; 953 KB
-
 ARM HAPL01.png 800 × 800; 194 KB
-
 Awans-sol.png 978 × 931; 1.68 MB
-
 Bengali Vocabulary2.png 282 × 280; 3 KB
-
 Bevolking van Groningen2010.png 631 × 628; 322 KB
-
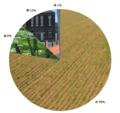
 Blankenberge - bodemgebruik.png 1,050 × 1,010; 1.36 MB
-
 Chart-dynamic-clay.png 2,400 × 2,400; 2.5 MB
-
 Chart-dynamic-color.png 2,400 × 2,400; 3.61 MB
-
 Chart-dynamic-gradient.png 2,400 × 2,400; 2.91 MB
-
 Chart-dynamic-premium.png 2,400 × 2,400; 3.63 MB
-
 Cornwall Council composition May 2011.png 584 × 574; 120 KB
-
 Daxingganlingecon.png 100 × 100; 2 KB
-
 Demographic.png 344 × 346; 5 KB
-
 Diagramm Flächenverteilung Hesselbach.png 591 × 609; 6 KB
-
 Dirichlet example.png 572 × 292; 28 KB
-
.png/111px-Disk_usage_(Boabab).png) Disk usage (Boabab).png 552 × 595; 74 KB
Disk usage (Boabab).png 552 × 595; 74 KB
-
 EconGas Eigentümerstruktur.jpg 209 × 158; 5 KB
-
 Eleições 2006 Rio.png 120 × 120; 2 KB
-
 Eleições 2006 RJ.png 120 × 120; 3 KB
-
 Erroneous golden angle pie chart.png 230 × 227; 7 KB
-
 Ethnicities Pie in Klaipėda.png 600 × 600; 24 KB
-
 European at the cinema 1996-2016.png 262 × 261; 9 KB
-
 Flickr licenses.png 289 × 261; 14 KB
-
 Grafsect.png 527 × 347; 113 KB
-
 GTRI awards by source.png 300 × 240; 10 KB
-
 Hereward House Pie Chart.png 616 × 598; 39 KB
-
 Heron sol.png 1,007 × 952; 1.37 MB
-
 How important to see titles?.png 232 × 231; 9 KB
-
 How learned about Signpost.png 233 × 233; 10 KB
-
 How users find the Signpost.png 232 × 232; 10 KB
-
 Hungarians in Slovakia by local percentage.png 480 × 480; 60 KB
-
 I4 Circ feren diagram.PNG 1,036 × 911; 26 KB
-
 I9 Circ feren diagram.PNG 909 × 911; 67 KB
-
 I91 Tor Diagram.PNG 1,036 × 911; 140 KB
-
 Imagefilledarc.png 100 × 100; 712 bytes
-
 Income inequality over time without oversight 0001.png 970 × 264; 14 KB
-
 Initiatives populaires par sujet.JPG 531 × 525; 34 KB
-
 Japan general election, 2005.png 1,200 × 1,200; 19 KB
-
.png/120px-Japanese_box_office_pie_chart_2016_(vi).png) Japanese box office pie chart 2016 (vi).png 684 × 545; 70 KB
Japanese box office pie chart 2016 (vi).png 684 × 545; 70 KB
-
 Kakediagram1.png 495 × 300; 15 KB
-
 Kakediagram2.png 491 × 300; 14 KB
-
 Kakediagram3.png 494 × 300; 14 KB
-
 Kakediagram4.png 477 × 275; 37 KB
-

-
 KreisDiag.png 234 × 228; 6 KB
-
 Kreisdiagramm Darstellung.jpg 159 × 150; 10 KB
-
 KreisDiagrammSex.png 327 × 327; 3 KB
-
 La Télé shareholding.png 200 × 200; 2 KB
-
-
 Mandatfördelning i Sveriges riksdag.png 326 × 342; 5 KB
-
 Neumuehle Bevoelkerungsanteil Heiligenstadt in Oberfranken.png 266 × 266; 24 KB
-
 Niigata gubernatorial election,2012.png 379 × 358; 16 KB
-
 Nuclear energy poll sweden.png 274 × 274; 14 KB
-
 Open-source-license-chart.svg 180 × 180; 82 KB
-
 PhlPerArt.png 1,024 × 768; 32 KB
-
 Pie 2.PNG 20 × 20; 769 bytes
-
 Pie Chart for Questions.GIF 444 × 432; 5 KB
-
 Pie Chart FTingetWikiEdit 2.png 1,050 × 1,033; 68 KB
-
 Pie chart partially exploded.jpg 748 × 644; 36 KB
-
 Pie Chart.PNG 1,157 × 751; 41 KB
-
 Pie-chart.jpg 556 × 516; 21 KB
-
 Pie-ChartPam.gif 180 × 285; 13 KB
-
 Piechart.png 703 × 321; 22 KB
-
 Piecharticon.png 233 × 141; 15 KB
-
 PieDiagram01.png 288 × 282; 10 KB
-
 PieDiagram02.png 266 × 263; 9 KB
-
 PieDiagram03.png 275 × 264; 11 KB
-
 PieDiagram04.png 298 × 287; 9 KB
-
 PieDiagram05.png 265 × 256; 10 KB
-
 PieDiagram06.png 348 × 323; 12 KB
-
 PieDiagram07.png 363 × 349; 9 KB
-
 PieDiagram08.png 347 × 319; 11 KB
-
 PieDiagram09.png 350 × 328; 15 KB
-
.JPG/120px-Population_age_structure_(Poltavska_Oblast%2C_2012).JPG) Population age structure (Poltavska Oblast, 2012).JPG 546 × 454; 27 KB
Population age structure (Poltavska Oblast, 2012).JPG 546 × 454; 27 KB
-
 Preferred way to receive the Signpost.png 233 × 233; 9 KB
-
 Prikkels-diagram.jpg 1,158 × 1,154; 61 KB
-
 Racial Breakdown of Albany NY.png 1,052 × 887; 160 KB
-
 Results of Spanish election 2011.png 506 × 505; 37 KB
-
 Reuland - sol.png 1,124 × 1,075; 1.47 MB
-
 Seattle uitgaven 2014.png 1,059 × 557; 21 KB
-
 Signpost subscriber list public or private.png 235 × 234; 8 KB
-
 Small pie.PNG 20 × 20; 833 bytes
-
 SRI awards by source.png 300 × 240; 13 KB
-
 Sweden foreigners.png 367 × 356; 3 KB
-
 Swedish television viewing 2006.png 597 × 593; 12 KB
-
 The frequency of the Fridays the 13th during the 28 years period.PNG 610 × 526; 97 KB
-
 The price of coffee 2.jpg 1,200 × 1,024; 131 KB
-
 The price of coffee.jpg 1,600 × 1,200; 216 KB
-
 Tokipona vortdeveno.PNG 786 × 431; 25 KB
-
 Tokyo gubernatorial election, 1967.png 460 × 401; 24 KB
-
 Tokyo gubernatorial election, 1971.png 465 × 409; 26 KB
-
 Tokyo gubernatorial election, 1975.png 362 × 357; 17 KB
-
 Tokyo gubernatorial election, 1979.png 370 × 356; 17 KB
-
 Tokyo gubernatorial election, 1983.png 370 × 360; 12 KB
-
 Tokyo gubernatorial election, 1987.png 364 × 360; 19 KB
-
 Tokyo gubernatorial election, 1991.png 349 × 346; 18 KB
-
 Tokyo gubernatorial election, 1995.png 339 × 283; 14 KB
-
 Tokyo gubernatorial election, 1999.png 391 × 356; 19 KB
-
 Tokyo gubernatorial election, 2003.png 334 × 282; 14 KB
-
 UitslagReferendumOekraine.PNG 749 × 572; 30 KB
-
 UK high definition providers q2 2009.png 91 × 95; 2 KB
-
 UK tv digital vs analogue providers q1 2009 main TVs.png 90 × 96; 1 KB
-
 UK tv digital vs analogue providers q2 2009 main TVs.png 90 × 96; 1 KB
-
 Uk tv digital vs analogue providers q3 2008.png 90 × 96; 1 KB
-
 UK tv digital vs analogue providers q4 2008 main TVs.png 90 × 96; 1 KB
-

-

-

-
 UK tv pay vs free providers q2 2009.png 90 × 96; 1 KB
-
 Uk tv pay vs free providers q3 2008.png 90 × 96; 1 KB
-
 UK tv pay vs free providers q4 2008.png 90 × 96; 1 KB
-
 UK tv reception q1 2009.png 91 × 96; 2 KB
-
 UK tv reception q2 2009.png 91 × 96; 2 KB
-
 Uk tv reception q3 2008.png 91 × 95; 2 KB
-
 UK tv reception q4 2008.png 91 × 95; 1 KB
-
 Venn Pie Chart describing Bayes' law.png 883 × 724; 61 KB
-
 Ventes Homogenic.PNG 1,383 × 1,106; 139 KB
-
 Vertebrates prop international.png 580 × 600; 98 KB
-
 Wikipediajournalen survey graph 1.png 600 × 600; 15 KB
-

-
 Національний склад населення Євпаторії.jpg 496 × 508; 39 KB


.png)


.png)


.JPG)


